Note
Access to this page requires authorization. You can try signing in or changing directories.
Access to this page requires authorization. You can try changing directories.
Digital twin builder (preview) is a Microsoft Fabric item for building operational analytics scenarios for physical operations. Digital twin builder provides a low-code/no-code experience that connects disparate data sources through Fabric and Azure IoT Operations, builds digital twins, and generates insights without specialized technical skills. Operations staff can explore twins based on their relationships and run time-series analytics within Fabric. Use the resulting insights to reduce waste, improve yield, enhance safety, and meet sustainability targets.
Important
This feature is in preview.
This tutorial walks you through building a scenario ontology in digital twin builder for the fictional energy company Contoso, Ltd. It covers modeling and contextualizing data from multiple sources, and finishes with a Power BI report that visualizes the data.
Prerequisites
- A workspace with a Microsoft Fabric-enabled capacity.
- Digital twin builder (preview) enabled on your tenant.
Fabric administrators can grant access to digital twin builder in the admin portal. In the tenant settings, enable Digital Twin Builder (preview).
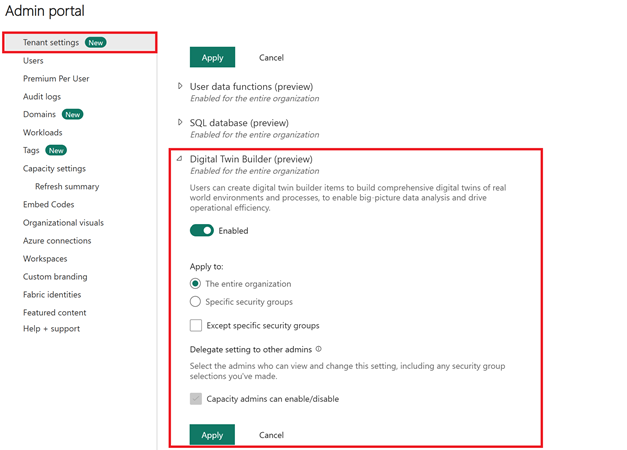
The tenant can't have Autoscale Billing for Spark enabled, as digital twin builder isn't compatible with it. This setting is also managed in the admin portal.
- The latest Power BI Desktop app installed on your machine. Tutorial part 5 (Create a Power BI report) requires Power BI Desktop and doesn't work with the Power BI service in Fabric.
Tutorial scenario: Contoso, Ltd. bioethanol distillation
This tutorial features the fictional energy company Contoso, Ltd., a bioethanol producer that wants to use digital twin builder (preview) across its distillation sites to improve efficiency, reduce energy consumption, and ensure product quality.
Contoso, Ltd. faces three challenges in its current distillation processes:
- Efficiency: Existing distillation units aren't optimized, which leads to longer processing times and higher operational costs.
- Energy consumption: The energy required to maintain the distillation process is substantial, which affects sustainability goals.
- Product quality: Variations in process parameters make it hard to ensure consistent product quality across different sites.
To address these challenges, Contoso, Ltd. needs to:
- Collect data and metadata from multiple sources, including sensors, control systems, and laboratory information management systems.
- Relate assets by creating semantic context that represents large processes and asset details.
- Scale semantic context to make data-driven decisions across sites.
The following diagram shows how the Contoso, Ltd. distillation process is structured:
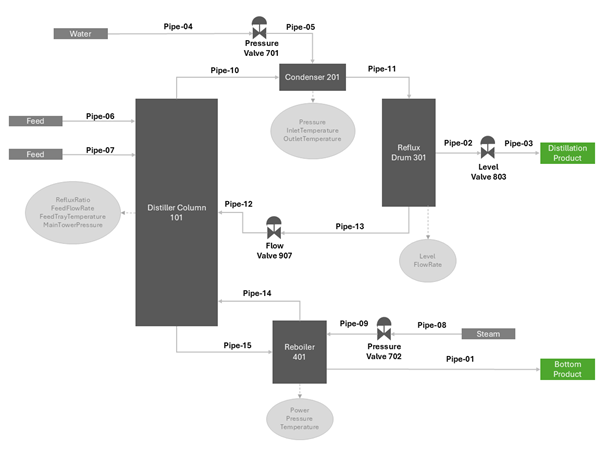
Digital twin builder integrates and contextualizes data from these sources into a unified view of the distillation process, so Contoso, Ltd. can optimize operations, reduce energy consumption, and improve product quality.
Sample ontology used in this tutorial
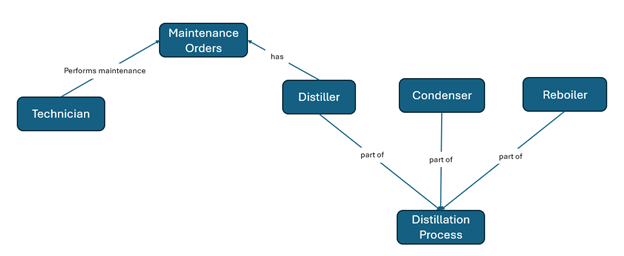
This tutorial uses a subset of the Contoso, Ltd. distillation process. The following ontology represents that subset:
Tutorial data summary
Contoso, Ltd. models and standardizes distillation processes across 10 sites in digital twin builder. Each site is an instance of the Process entity type.
Raw data sources used in this tutorial
For this tutorial, you use the following data sources:
| Data type | Usage |
|---|---|
| Asset data | Asset definitions for Distiller, Condenser, and Reboiler. Each of those entity types has 10 instances defined in the table. |
| Time series | Wide-formatted operational data. |
| Maintenance requests | Maintenance requests associated with a particular technician and equipment. |
| Technicians | SAP data detailing technicians working at sites. |
| Distillation process data | MES / process data for multiple sites, containing start and end times and waste KPIs for each process entry. A customer brings in the MES data and contextualizes it with asset and event data, in order to isolate each process that occurred. |
Operational time series data
Through an edge system, Contoso, Ltd. receives time series data from its sites. All sites perform the same distillation process, which includes the following assets:
- Distiller: Produces time series data for
RefluxRatio,MainTowerPressure,FeedFlowRate, andFeedTrayTemperature. - Condenser: Produces time series data for
Pressure,Power, andTemperature. - Reboiler: Produces time series data for
Pressure,InletTemperature, andOutletTemperature.
These measurements help monitor and control the distillation process, ensuring efficient and safe operation.
What you build in this tutorial
In this tutorial, you:
- Set up your environment and deploy a digital twin builder item.
- Create entity types, and map property and time series data to them.
- Define semantic relationships between entity types.
- Search and explore your ontology.
- Create a Power BI report with digital twin builder data.
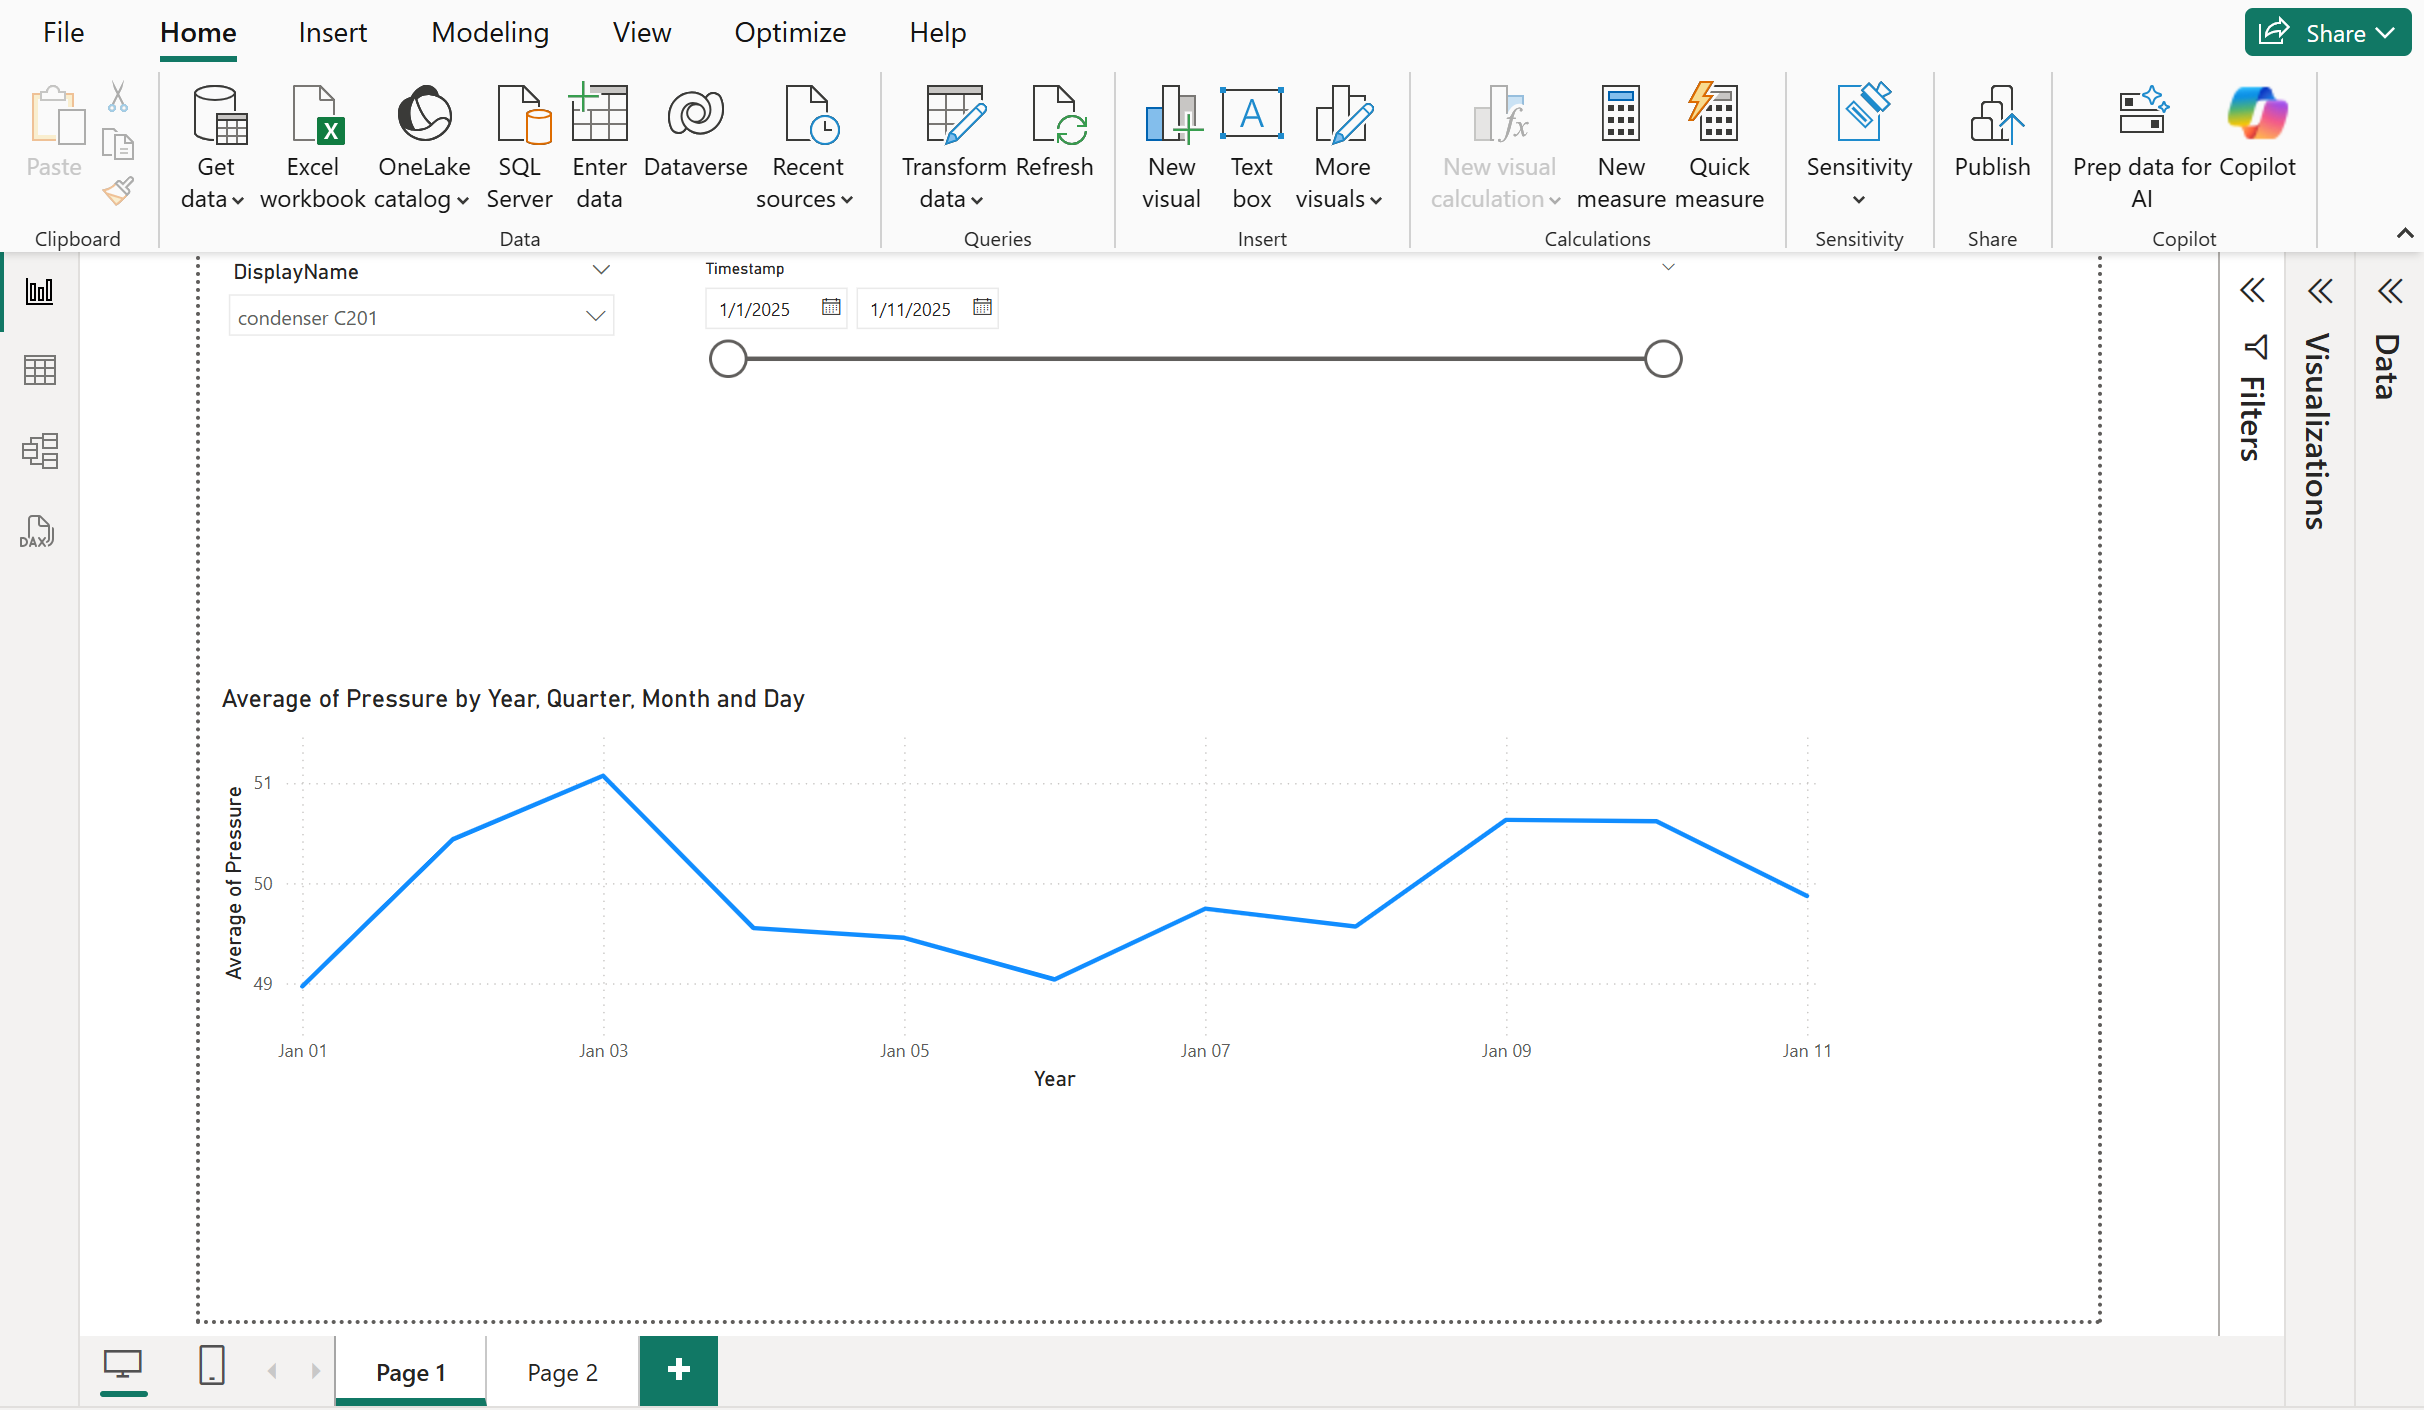
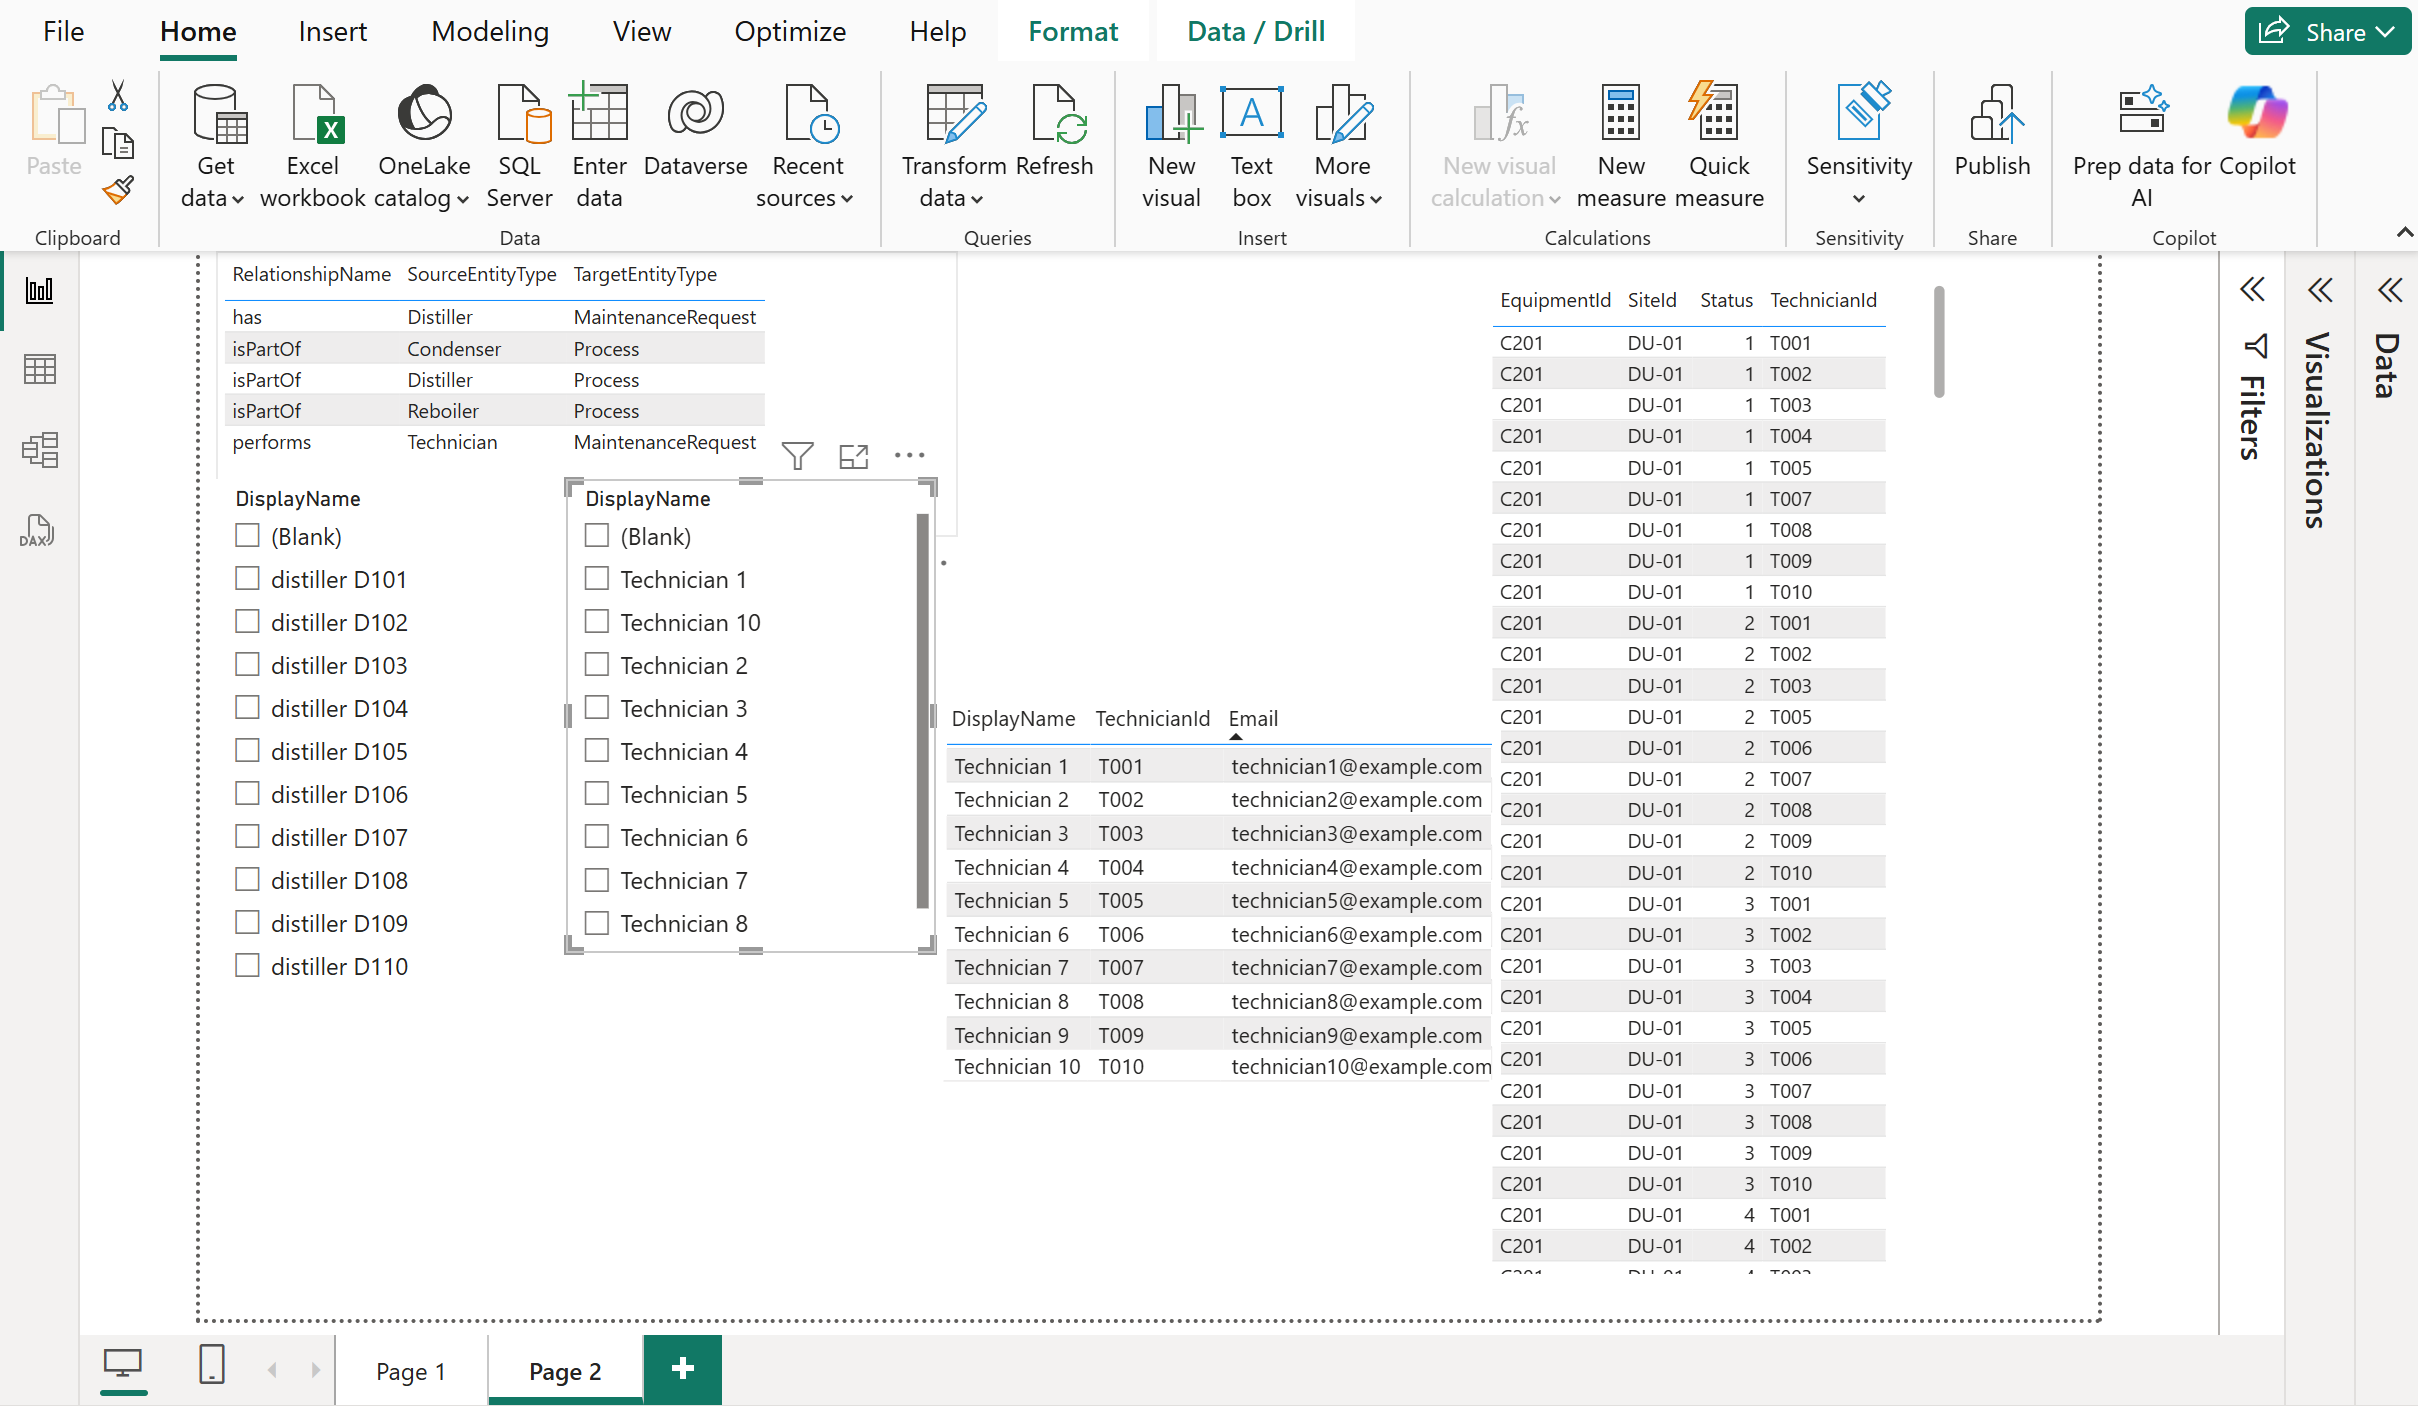
The following images show the Power BI report you build in tutorial part 5.